Contact
Abstract graphic showing indoor space with wireless signal elements – symbolizing mobile and Wi-Fi coverage

We analyze your network
Indoor Radio Survey

MEASUREMENT OF MOBILE RADIO NETWORKS AND WLAN NETWORKS

Reliable Indoor Signal Coverage

Reliable indoor signal coverage starts with precise measurement – for mobile networks including 5G, 4G, 3G, 2G, Wi-Fi, campus networks & more.
We make sure your facility is optimally covered – with professional measurement, expert consultation and tailored implementation.

👉 Request a consultation

Modern office building with glass facade and open-plan design, people in motion; symbolizing mobile measurement for indoor radio coverage using portable Wi-Fi and 5G survey equipment
Smart building infrastructure requires precise indoor radio surveys – visualized here in a corporate setting.

Radio Survey & Optimization from a Single Source:
Indoor radio measurement for every technology – independent of providers

Fast, efficient and autonomous – we measure the real radio coverage in your facility.

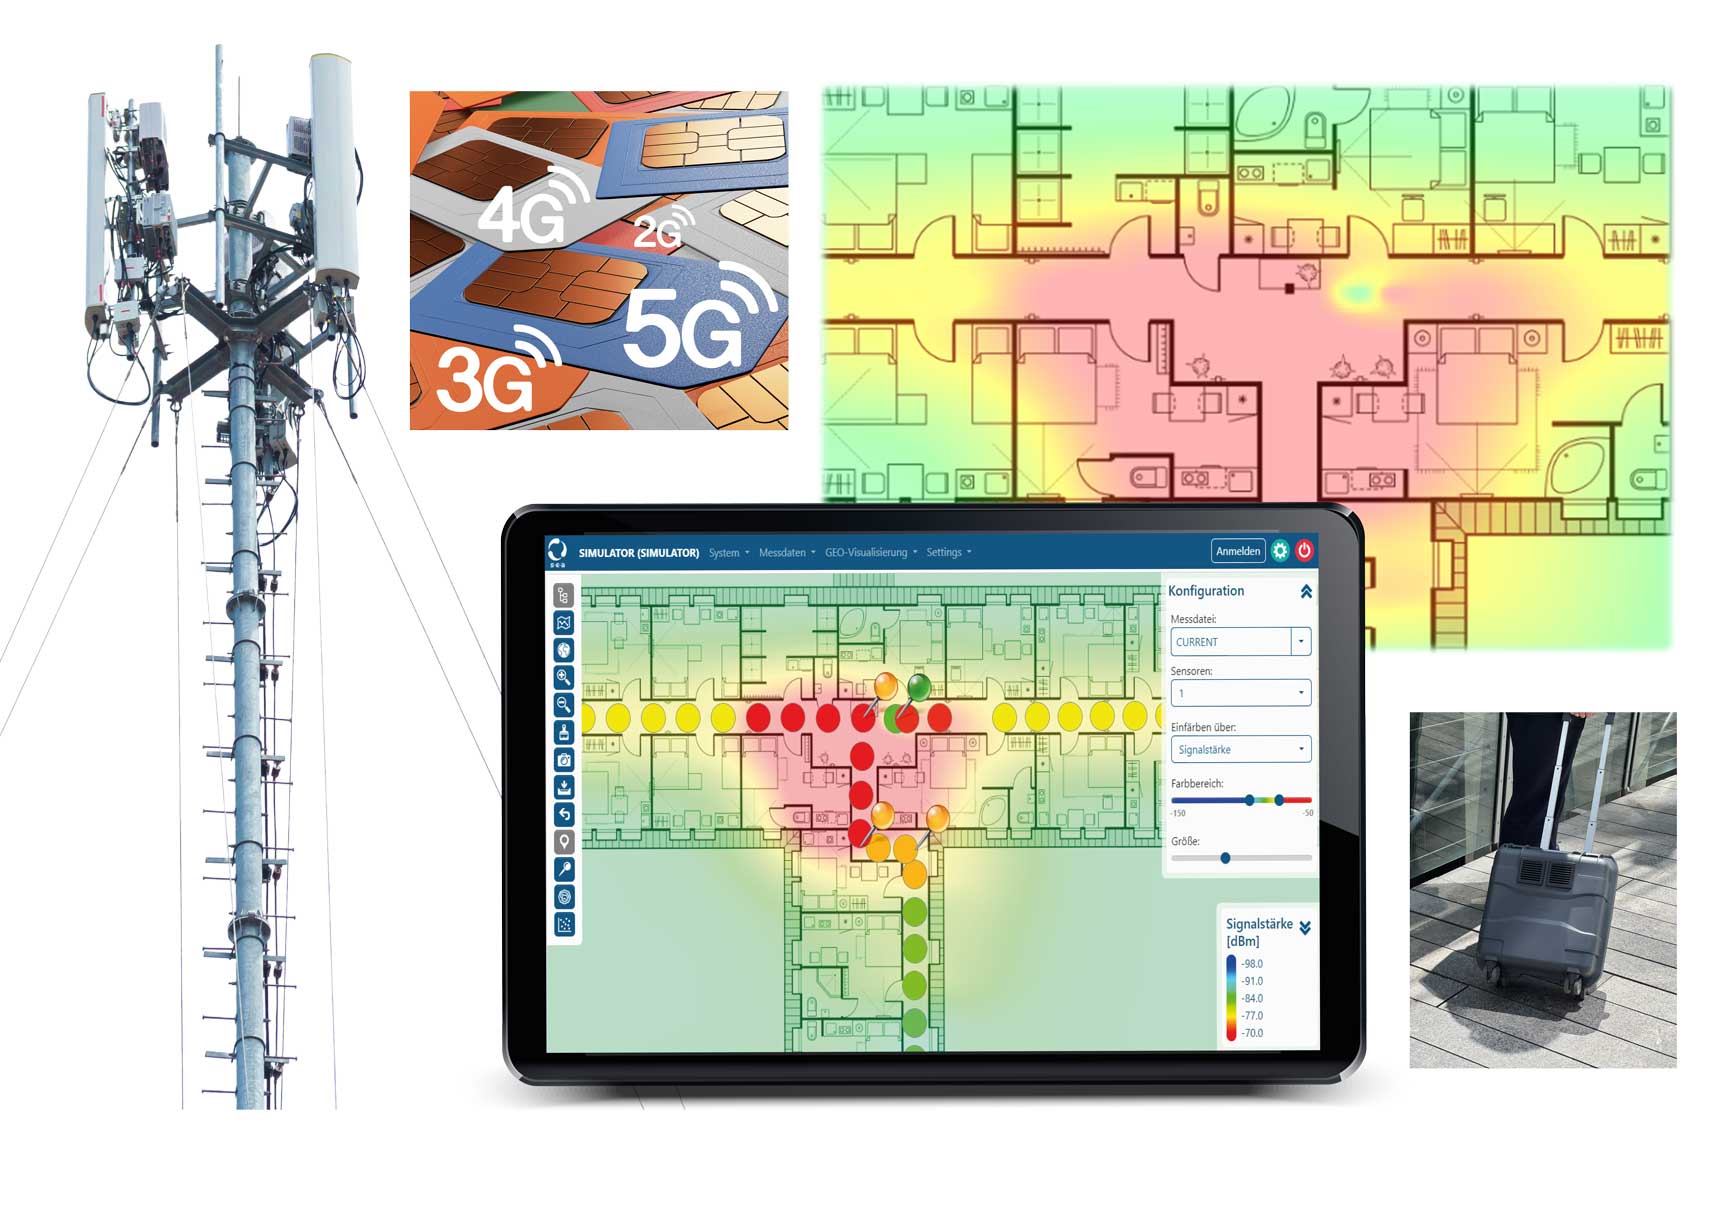
We capture actual signal conditions in your building – for all common mobile technologies (2G, 3G, 4G, 5G) and independent of network providers. Whether public mobile networks, campus networks or private wireless infrastructures – we provide full transparency and targeted optimization.

  • Comprehensive measurements with up to 40 parallel frequency channels
  • Support for all mobile technologies and frequency bands
  • Drive & walk tests – including in GPS-denied environments
  • Interactive visualizations of measurement data (e.g. heatmaps, CIDs, signal strength)
  • Consulting & implementation for network optimization

Ready for the next step?

From measurement to optimization – whether already surveyed or in need of improvement–

You already know where your network needs improvement?
Our experts support you with professional mobilenetwork optimization – reliable, efficient and tailored to your requirements.

👉 See how we improve your coverage

Tablet displaying indoor signal heatmap and measurement data next to antenna and network equipment

Why choose our indoor radio survey?

Because standard methods aren’t enough when it comes to availability.

  • Objective & neutral: We measure independently of providers and technologies.
  • Realistic results: Direct signal registration under real network conditions – no simulation.
  • Autonomous & efficient: No complex installation required, quickly ready to use.
  • Transparent: All data is documented, analyzed and reported in a comprehensible way.
  • Full control: You receive all data, visualizations and strategic recommendations.
Two business professionals shaking hands in a modern office building, overlaid with digital data icons such as smartphone, search, charts, and documents – symbolizing digital collaboration and data-driven project management.

We measure for you!

With our team and our mobile survey vehicles

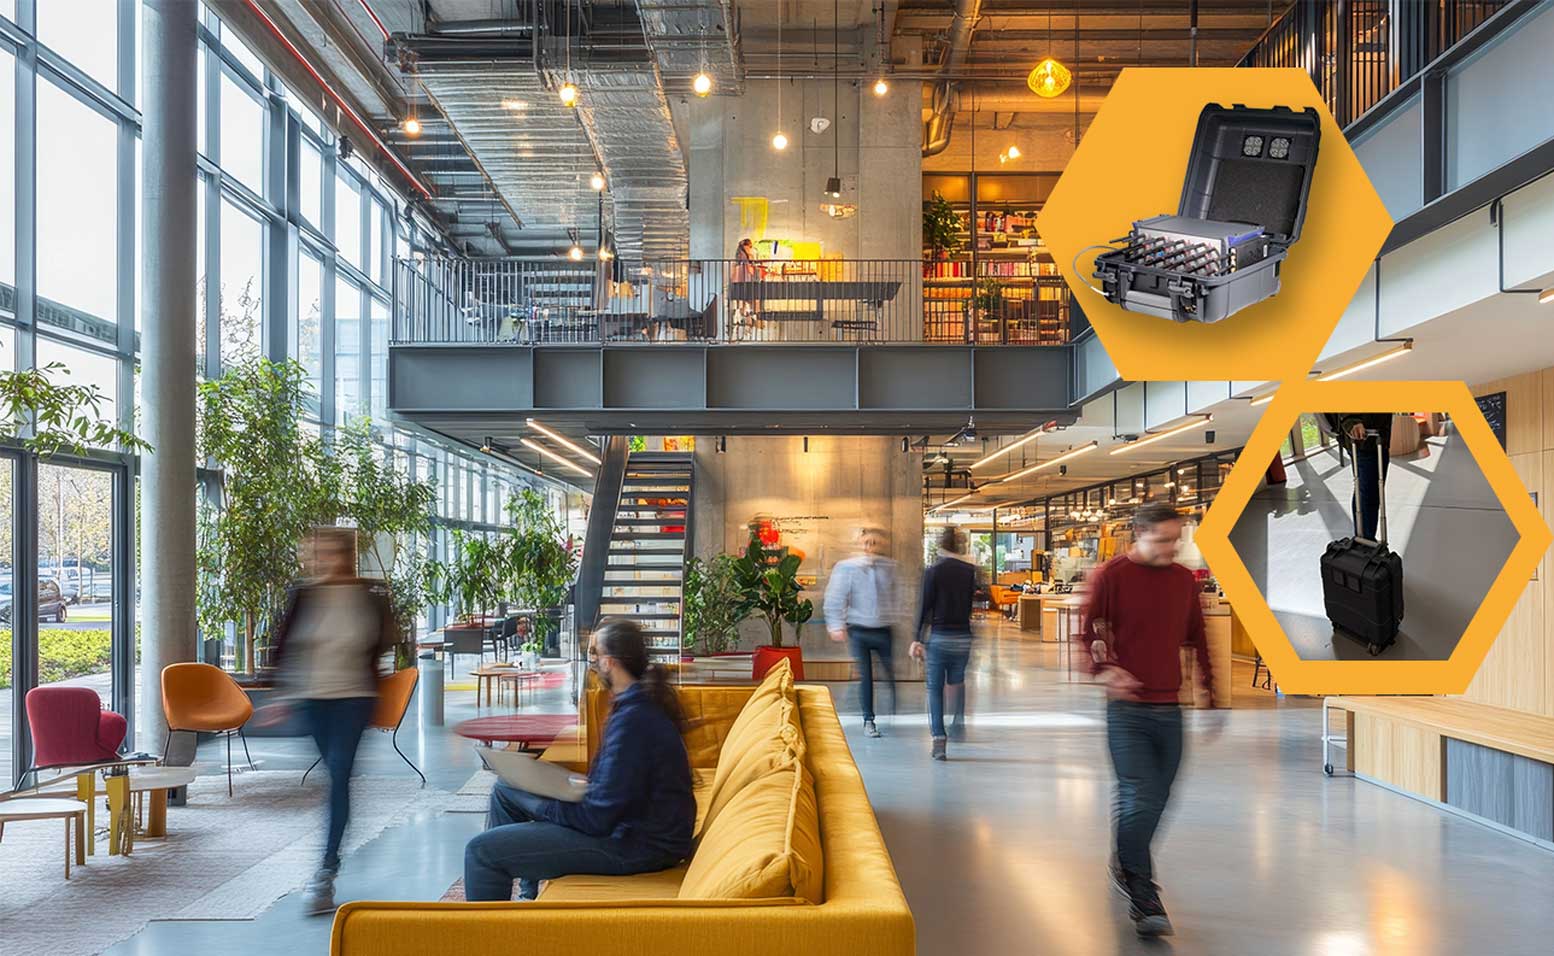
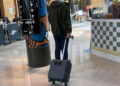
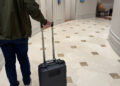
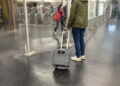
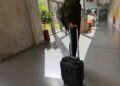
We use multi-channel systems for walk tests inside buildings or mobile measurements from our vehicles. This allows us to quickly and dynamically assess the current mobile network conditions in your facility and across larger areas – by capturing all networks, technologies, and frequency bands at the same time.

Typical areas of application for our measurements

Our customers operate wherever network coverage is critical:

  • Icon of a hospital with a cross symbol – symbol for medical facilities, healthcare, or emergency services.

    Radio coverage in hospitals and care facilities

    Hospitals and nursing homes

  • Icon einer Bildungseinrichtung mit Absolventenhut – Darstellung für Schule, Universität, Hochschule oder Bildungseinrichtungen allgemein.

    Digital infrastructure in educational institutions

    Schools, universities, and training centers

  • shopping center symbol in-house radio coverage.jpg

    Commercial properties with communication needs

    Shopping centers, office complexes, retail spaces

  • Stylized icon of an industrial building representing factory or production environments

    Connectivity in industrial environments

    Manufacturing sites, warehouses, logistics

  • Symbol graphic of an airport or transport hub – stands for reliable mobile communications coverage at stations, terminals, and security areas

    Indoor signal solutions for transport & events

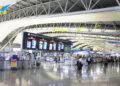
    Airports, rail stations, hotels and exhibition centers

  • Icon of a subway or commuter train in an underground station with tracks, benches, and tunnels—symbol for public transportation, rail infrastructure, or urban mobility.

    Radio coverage in urban underground spaces

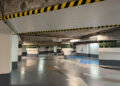
    Tunnels, subway stations, underground parking garages

Whether hospital, factory hall or shopping center – we make your wireless coverage visible.
Talk to our experts about a survey in your specific facility.

👉 Start your request or schedule an appointment

Large, modern airport terminal with check-in counters, passengers, and digital display boards – a relevant location for indoor radio surveys and network optimization
Person carrying a mobile survey case at the entrance of a modern campus building – preparing for indoor coverage analysis on a university or research campus
Person with a mobile survey case riding an escalator inside a shopping mall – indoor radio measurement across multiple building levels
Person with a mobile radio survey case inside a shopping mall with a food court – measuring indoor signal coverage in public spaces
Two forklifts driving through a large warehouse with stacked cartons – a typical environment for indoor radio surveys in logistics operations
Person with mobile measurement case for indoor signal testing in front of elevators in a modern hotel or office building – wireless network analysis in reception areas
Person with a mobile measurement case for indoor signal testing in the entrance area of a subway station – analyzing network coverage in urban public transport
Underground parking garage with low ceiling and marked parking spaces including disabled parking – typical scenario for indoor radio measurement without GPS signal
Medical staff in motion in a hospital corridor near the intensive care unit – critical zone for reliable indoor wireless measurement and signal coverage.
Person with a mobile measurement case for indoor signal testing at the entrance of a shopping mall – measuring mobile coverage in retail environments.
Caregiver talks to elderly woman in a wheelchair in a homelike nursing room – indoor signal measurement for stable network connectivity in care facilities
Person with a mobile measuring case conducting indoor signal testing in a modern office or educational building with daylight and a glass façade.
Person mit mobilem Messkoffer für Funkvermessung auf einem rot-weiß markierten Gehweg in einem Tunnel oder Tiefbauwerk – Einsatzszenario ohne GPS-Signal.
Technician with hard hat and safety vest analyzes radio signal data on a laptop inside a modern industrial hall – use case for indoor signal measurement in production environments.
Person with a mobile signal testing case entering a modern office building – mobile and ready to deploy.

How It Works – The Process of Indoor Radio Network Measurement

From site definition to final analysis:
This is how we capture your network coverage step by step

Step-by-step workflow of indoor radio measurements – from planning to analysis and visualization
Digital map view and building floor plans on a computer screen – preparation for indoor radio measurement using CAD plans and location data.
Digital project preparation for indoor radio measurement – building plans, floor plans, and location data are structured in advance and supplemented with relevant additional information.

1. Digital preparation of the radio network survey

The basis for precise measurements – your plans, our system

Before the actual radio survey begins, we prepare the project digitally and structurally in the best possible way:

  • Reading in your building plans, floor plans or CAD files
  • Defining the object hierarchy: location → building → floors → rooms
  • Integrating additional information (e.g. access points, usage zones). e.g. entrances, usage zones)
  • Can be created in advance and reused
Map view with GPS correction: Software interpolates missing data and displays corrected route.
Automated correction of GPS outages during radio measurement – The software interpolates missing GPS data based on defined time or distance intervals and visualizes the corrected route on the map.

How Do We Measure –
and What Do We Use?

Our expertise for your network coverage:

  • Proprietary multi-channel drive test systems for simultaneous measurement of all mobile standards: 2G / 3G / 4G / 5G / NB-IoT / LTE-M
  • Custom-built multi-channel Wi-Fi scanners for detecting access points in the 2.4 GHz, 5 GHz, and 6 GHz bands
  • In-house Industrial IoT (IIoT) measurement systems – specifically designed for LTE-M and NB-IoT
  • Our own fleet of vehicles and experienced field teams for drive test execution – or through a qualified partner network
  • Proprietary analysis platform “SpaceMaster” for evaluation, map-based visualization, GPS correction, and automated reporting
  • Manufacturer competence & years of development experience: All measurement systems are developed and produced in-house – proven, precise, and professional

🔍 Your benefit: Top measurement quality, maximum flexibility, and in-depth expertise for indoor and outdoor radio network surveys.

Portable trolley-based measurement system for indoor walk tests, next to vehicle-installed measurement hardware for mobile drive tests to capture radio coverage.

2. Measurement Execution

On-site data collection with state-of-the-art technology – autonomous & precise

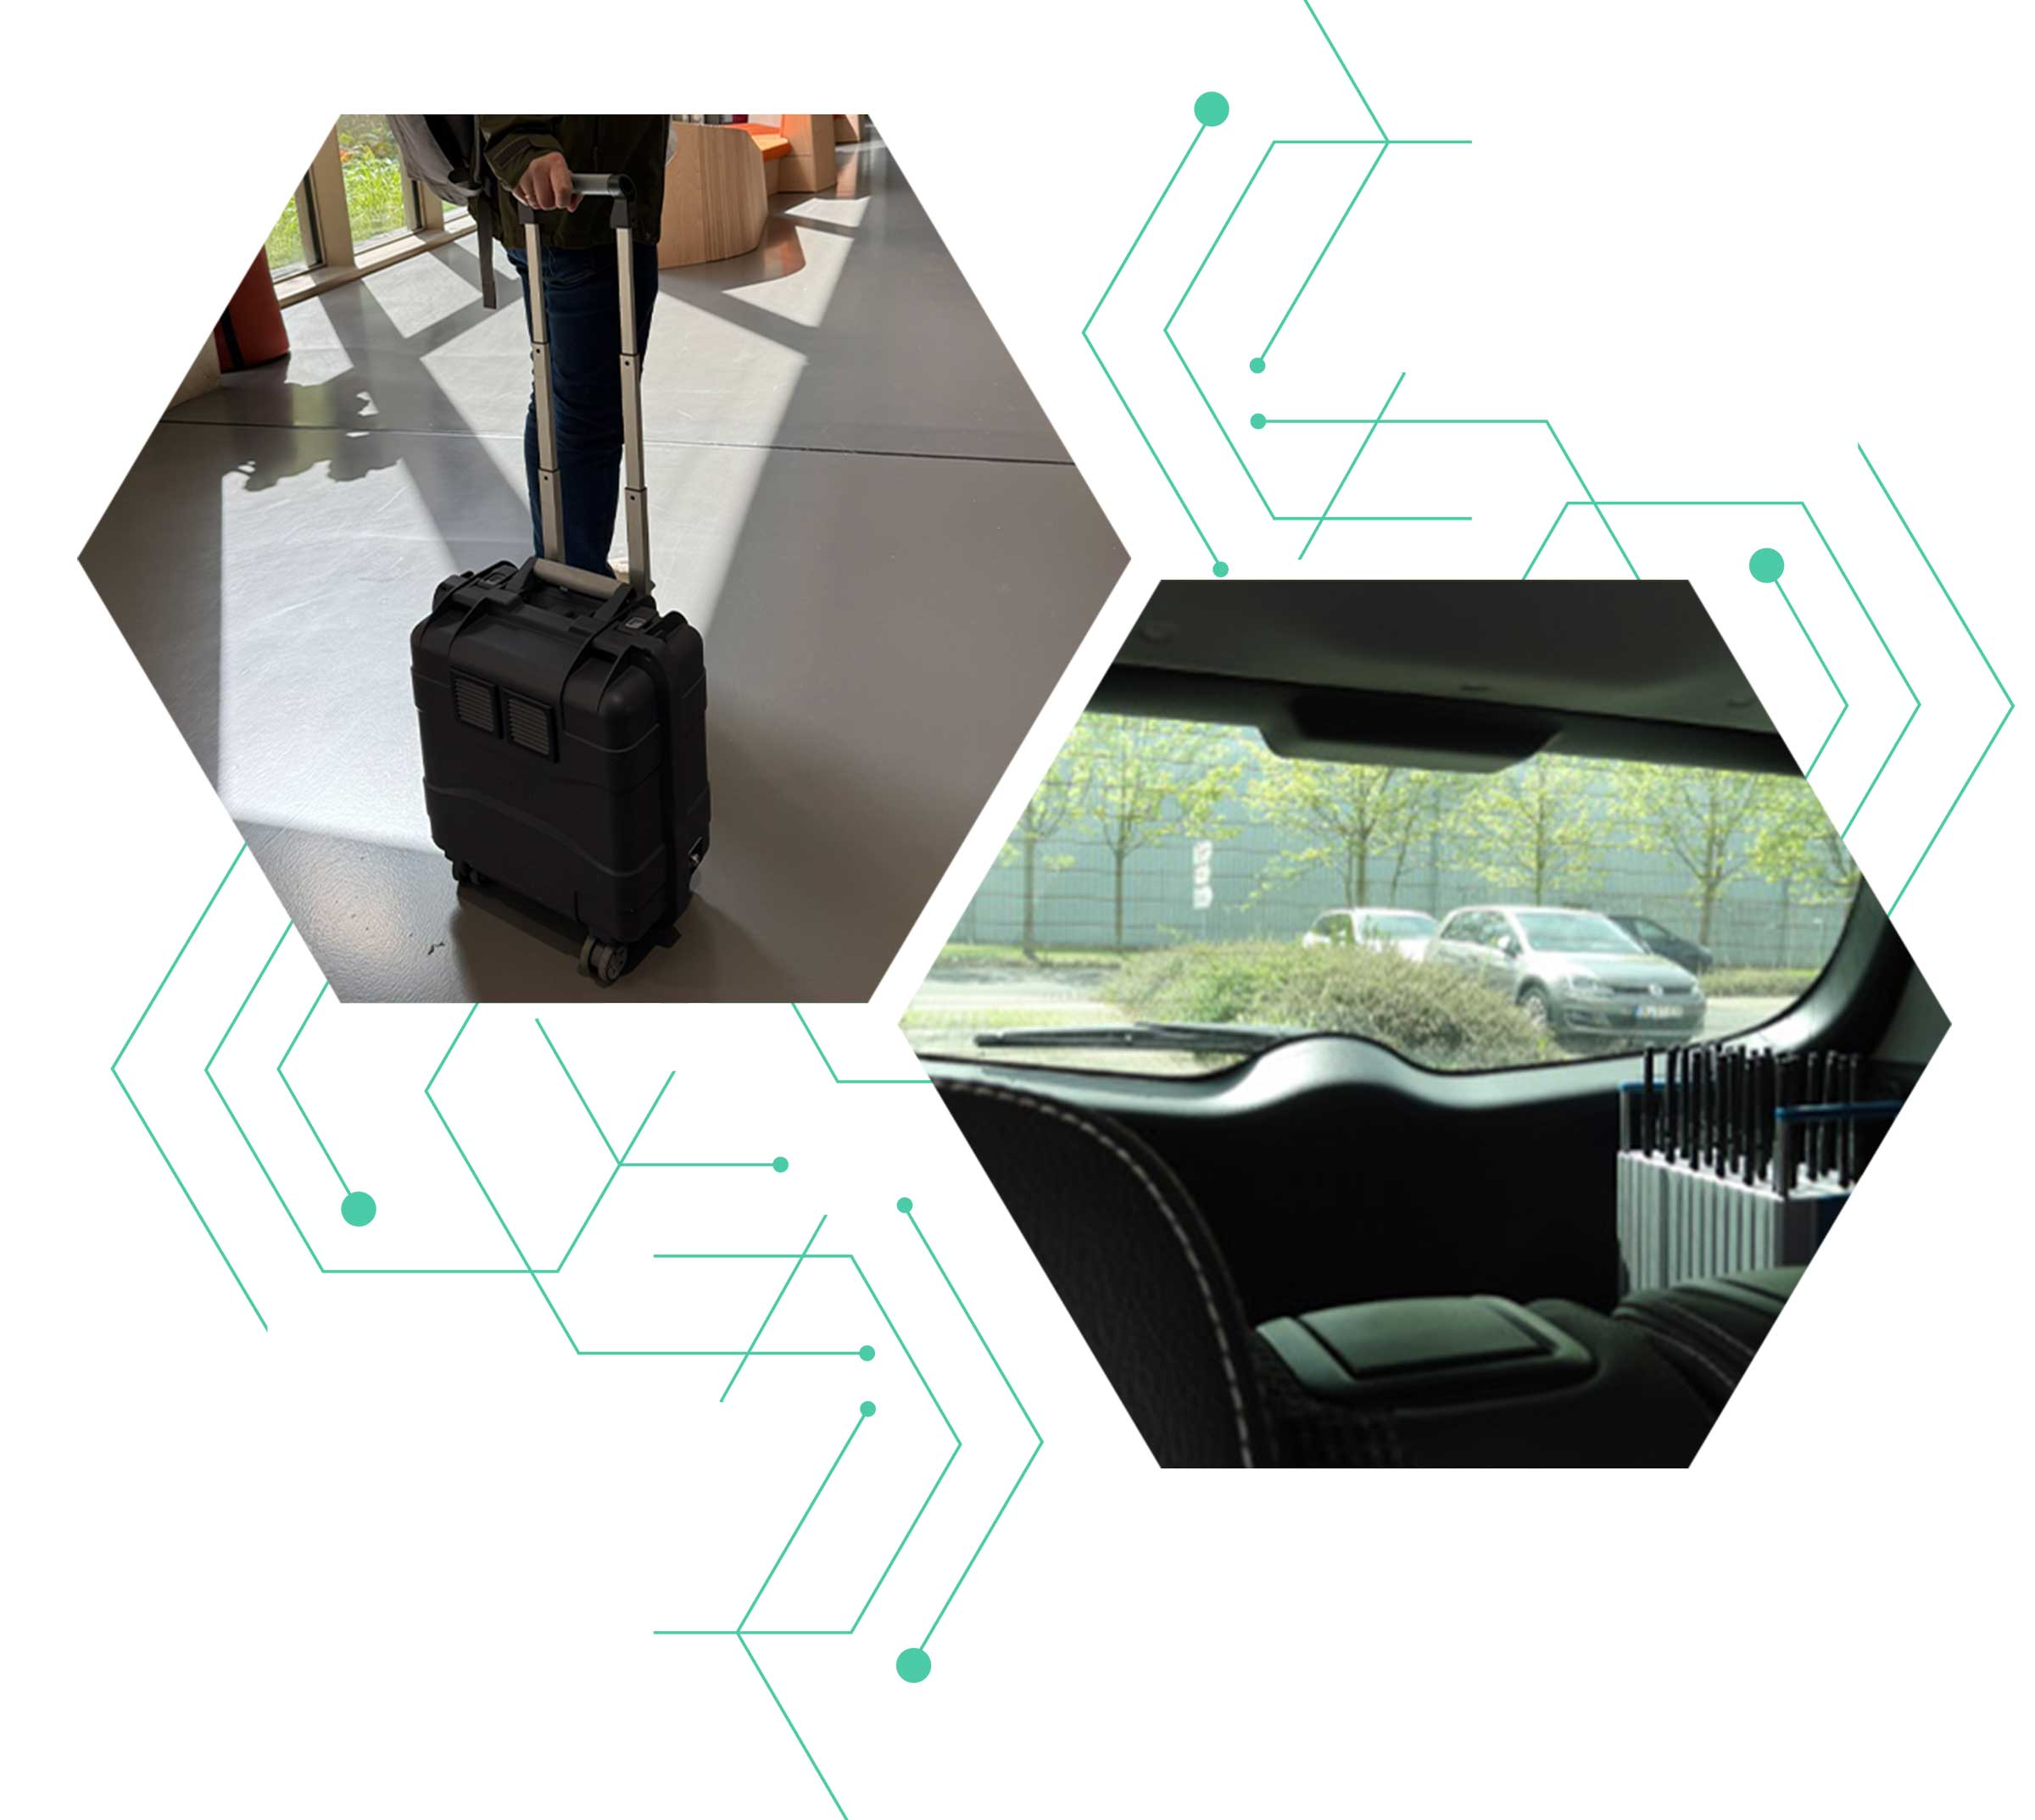
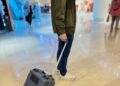
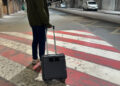
On site, we perform the measurement either as a walk test or drive test – depending on the environment:

  • Measurement with up to 40 parallel channels across all mobile technologies (2G to 5G)
  • Fully automatic detection of all radio cells, regardless of the operator
  • Usable even without GPS signal – e.g., in tunnels, basements, or hospitals
Software interface for signal strength interpolation on a building floor plan – visualization of measurement points using a color scale, configuration options for sensors, measurement data, and interpolation modes for radio coverage analysis.
Digital interpolation of indoor radio measurement data – The software enables graphical evaluation of signal strengths based on interpolated measurement points and provides comprehensive tools for adjusting, visualizing, and editing data positions.

3. Interpolation & Editing of Measurement Points

Fine-tuning for a realistic representation of network coverage

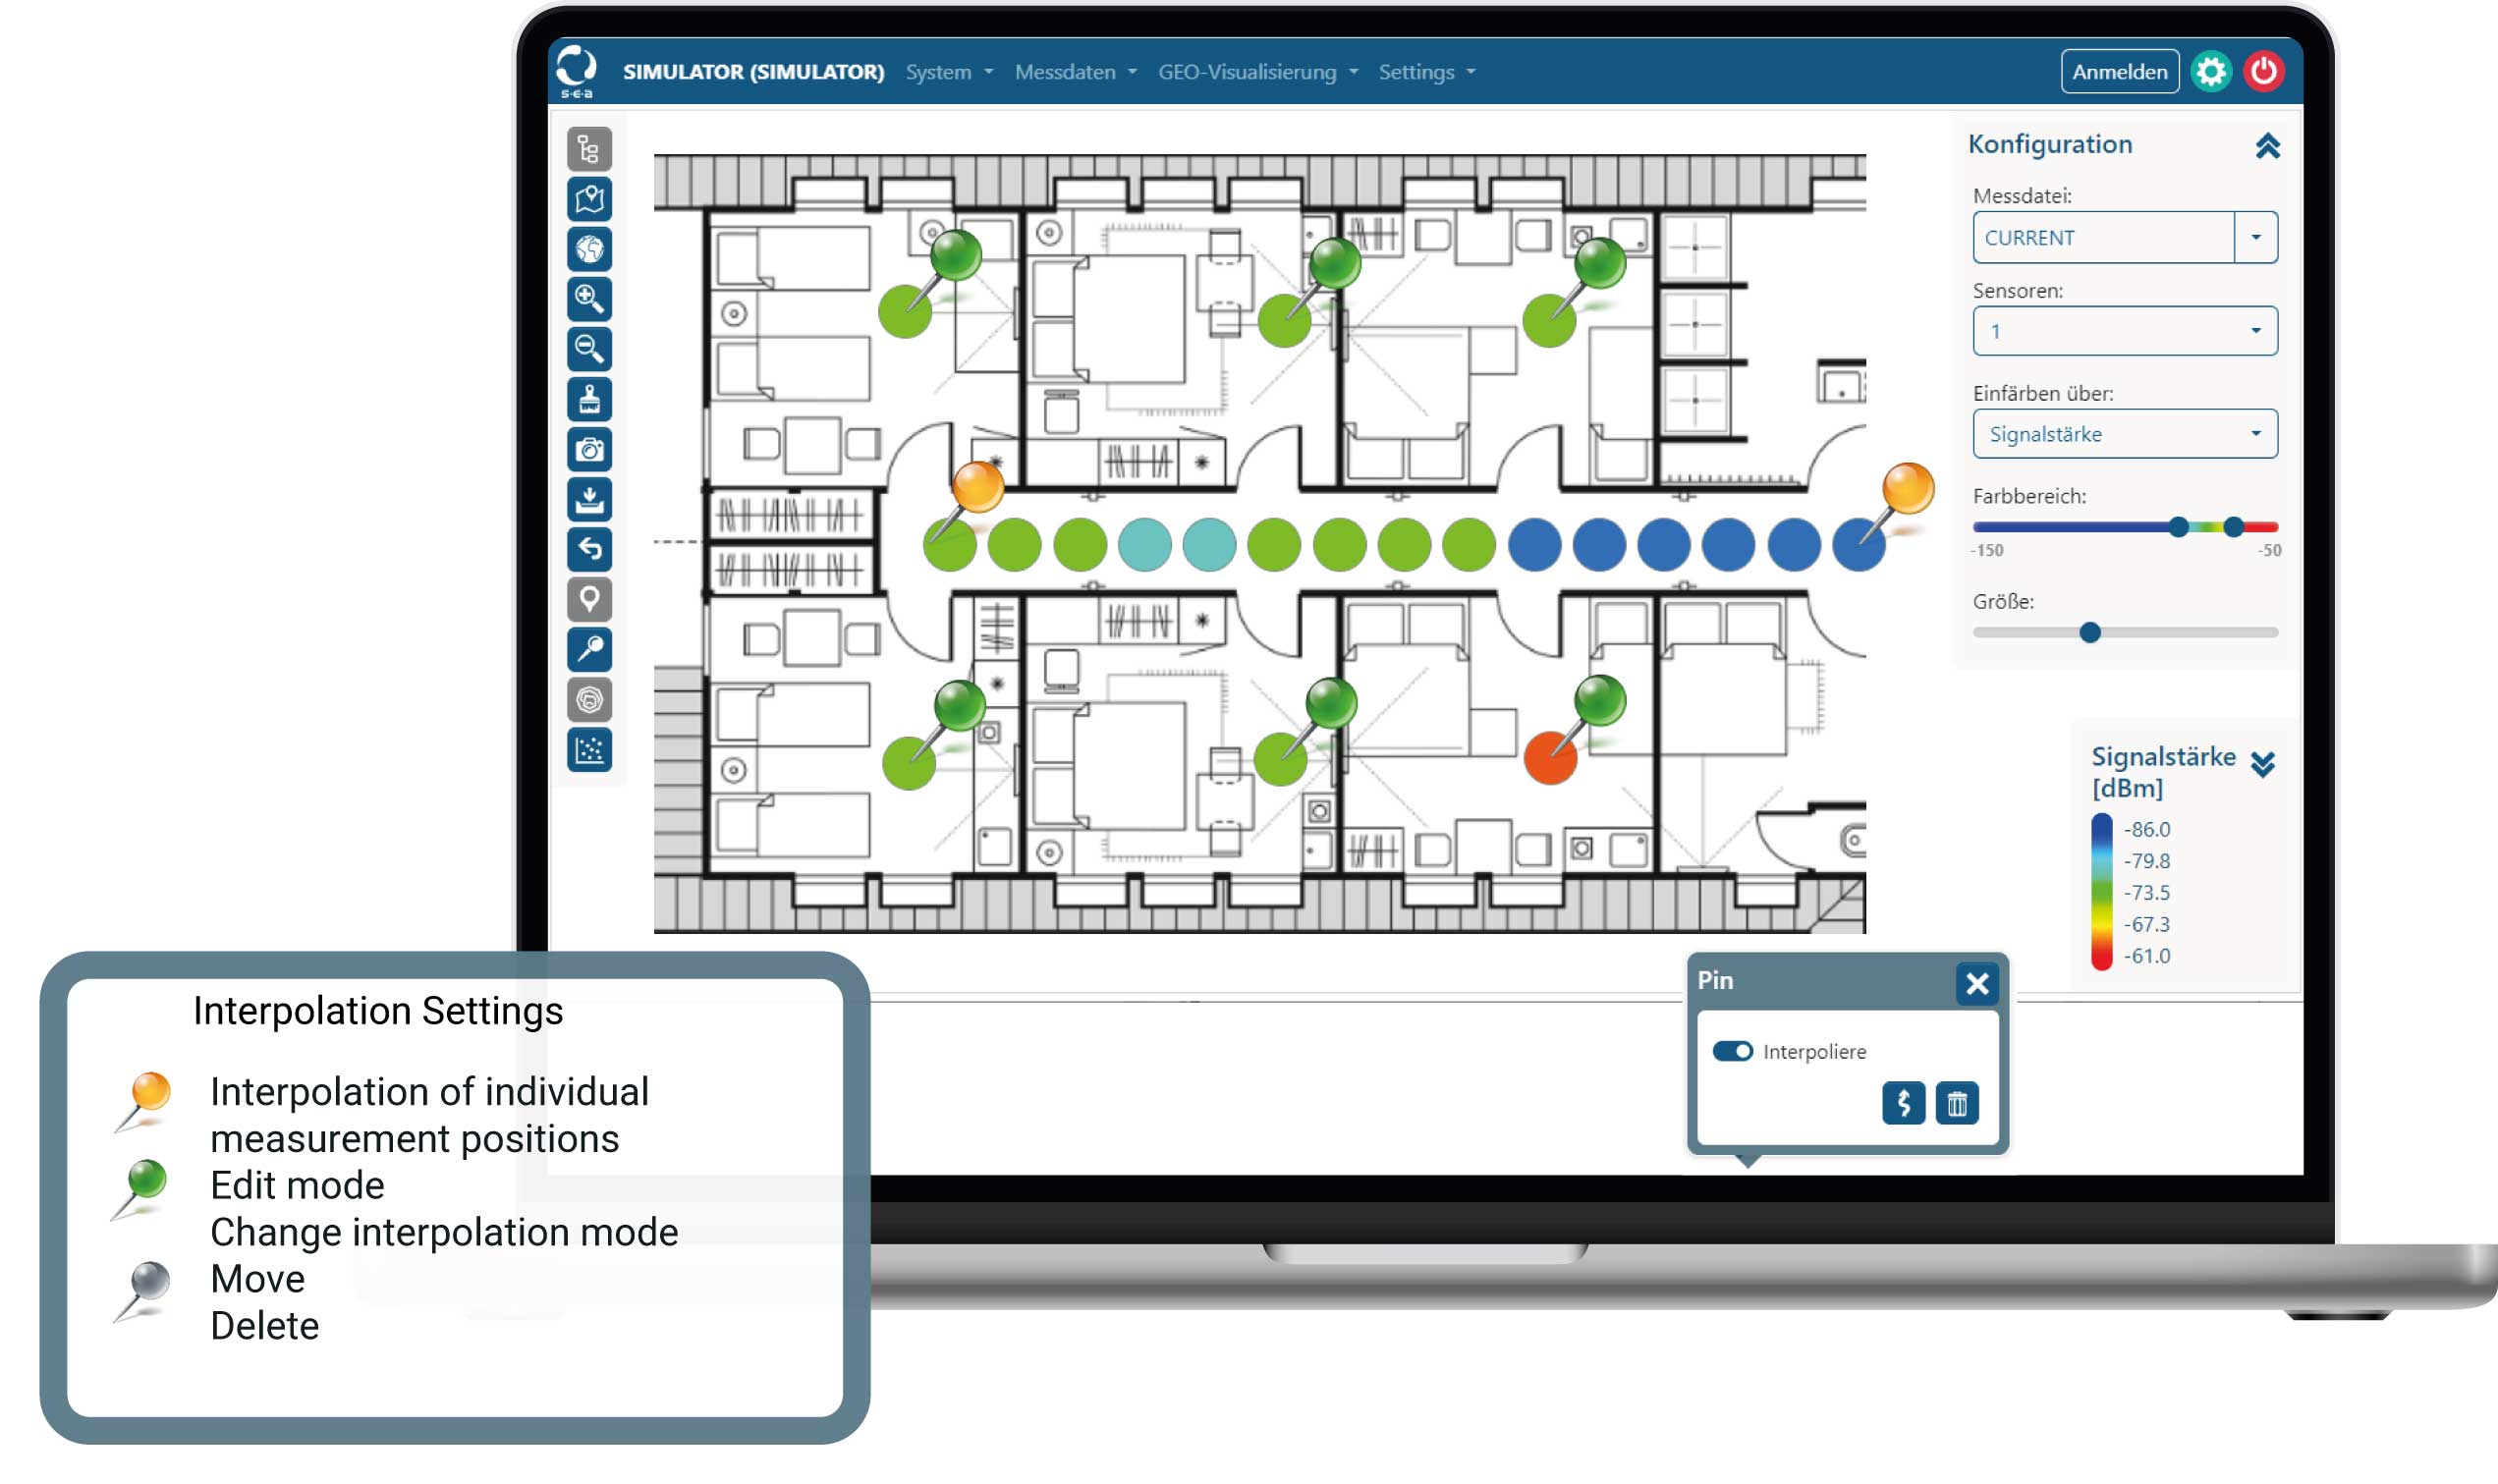
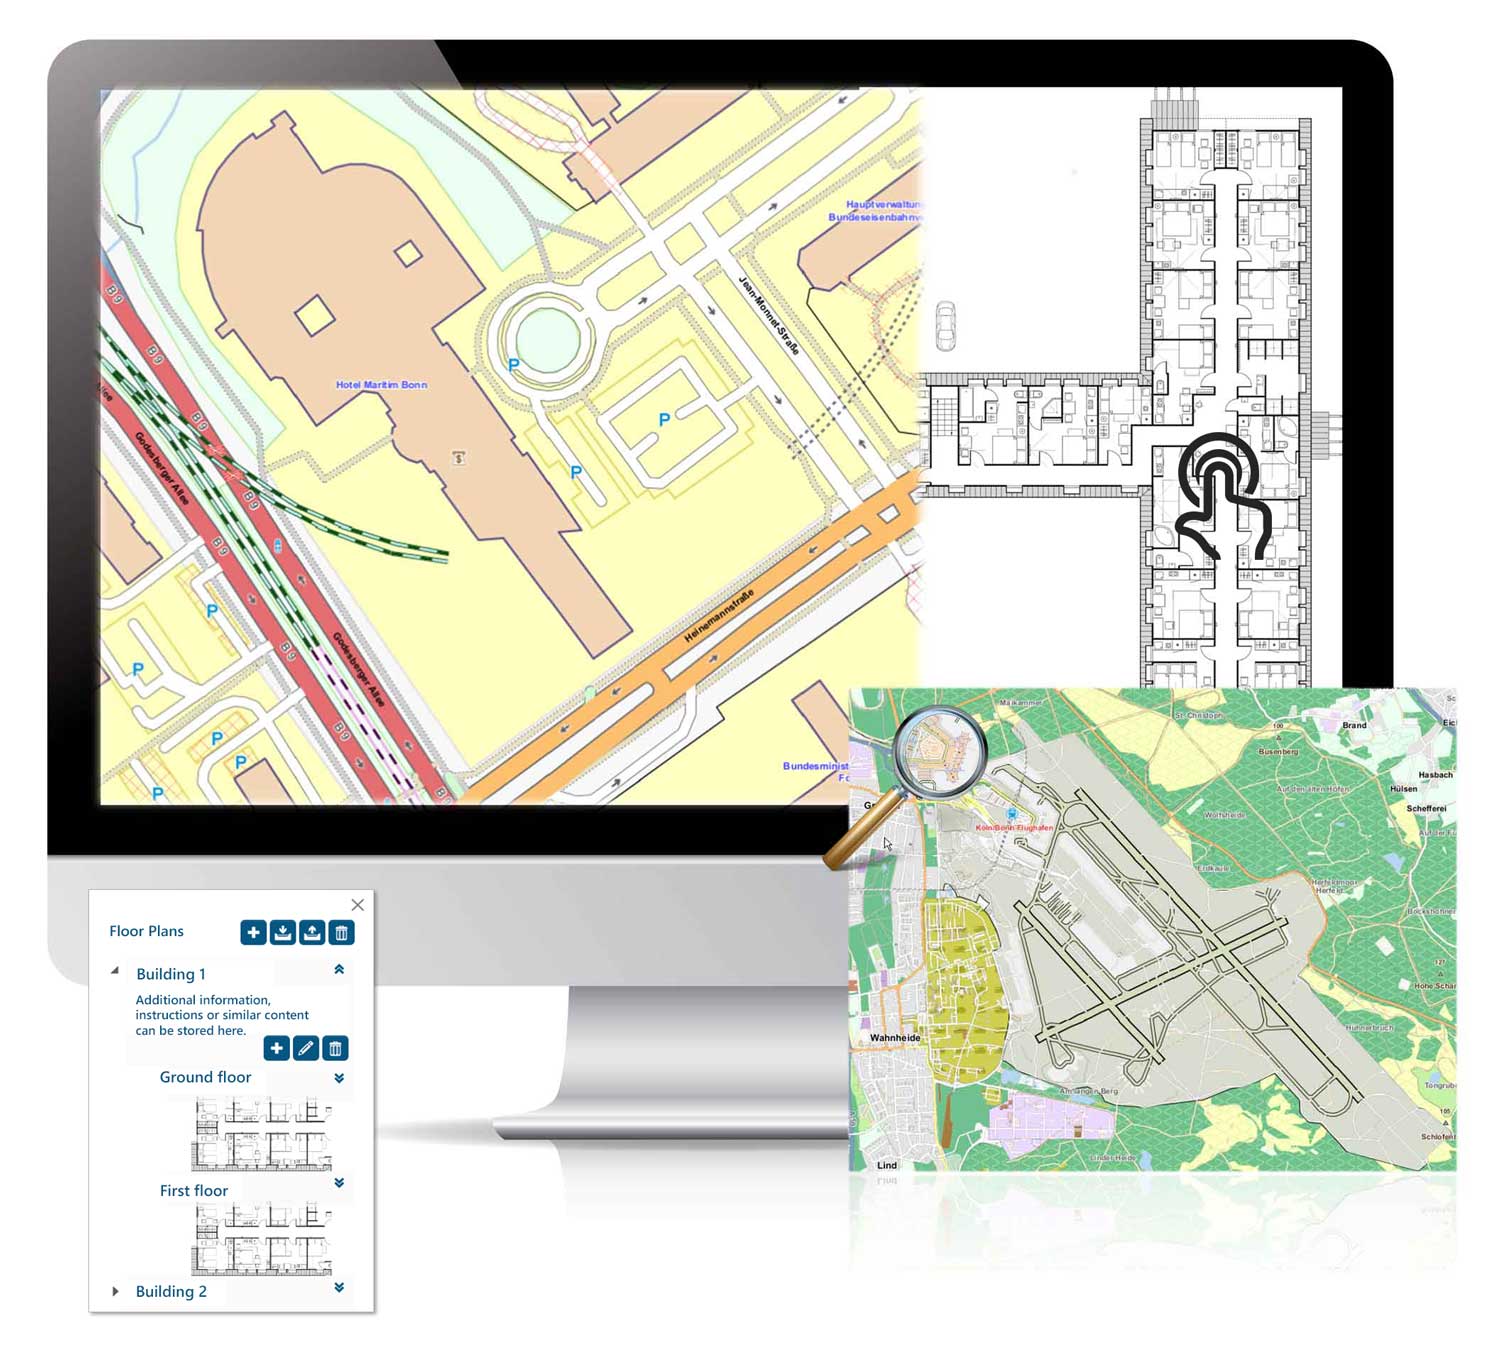
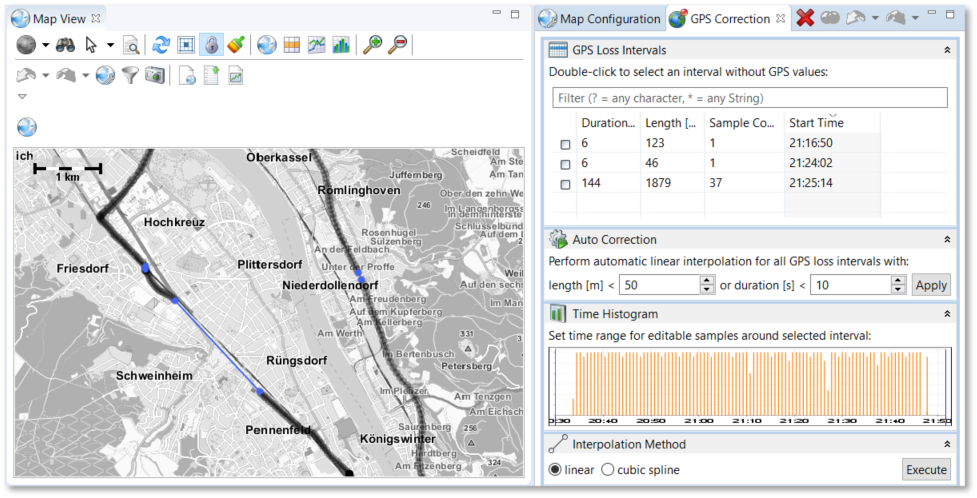
After the initial analysis, the results are refined through interpolation of the recorded positions. Signal values between actual measurement points are calculated to enable continuous visualization (e.g., in heatmaps).

In editing mode, the following is possible:

  • Adjust interpolation modes (e.g., linear, full coverage)
  • Move or delete individual measurement points
  • Exclude outliers or faulty measurements

Goal: A realistic and meaningful network profile that accurately reflects the actual coverage situation.

Analysis and visualization of radio measurement data on laptop, tablet and smartphone – Signal strength heatmap on building layout with mobile test results for download rate, upload rate, latency and LTE signal strength
Multi-platform analysis of radio surveys – Visualization and evaluation of LTE signal data including signal strength, transfer rates and latency via interactive heatmaps and digital building floor plans

4. Analysis

Making the invisible visible – clear and interactive

After the measurement, we evaluate the collected data in a structured and comprehensible way:

  • Visualization of measurement points as heatmaps, signal strength graphs, and cell identification (CID)
  • Interpolation between measurement points to represent continuous coverage
  • Detailed view for overlapping or complex measurement scenarios
Display and filtering of measurement points – interface with heatmap, signal strength, and cell ID (CID) including layer view for detailed radio analysis

Display and filtering of measuring points

Detail view & layer display for precise analysis

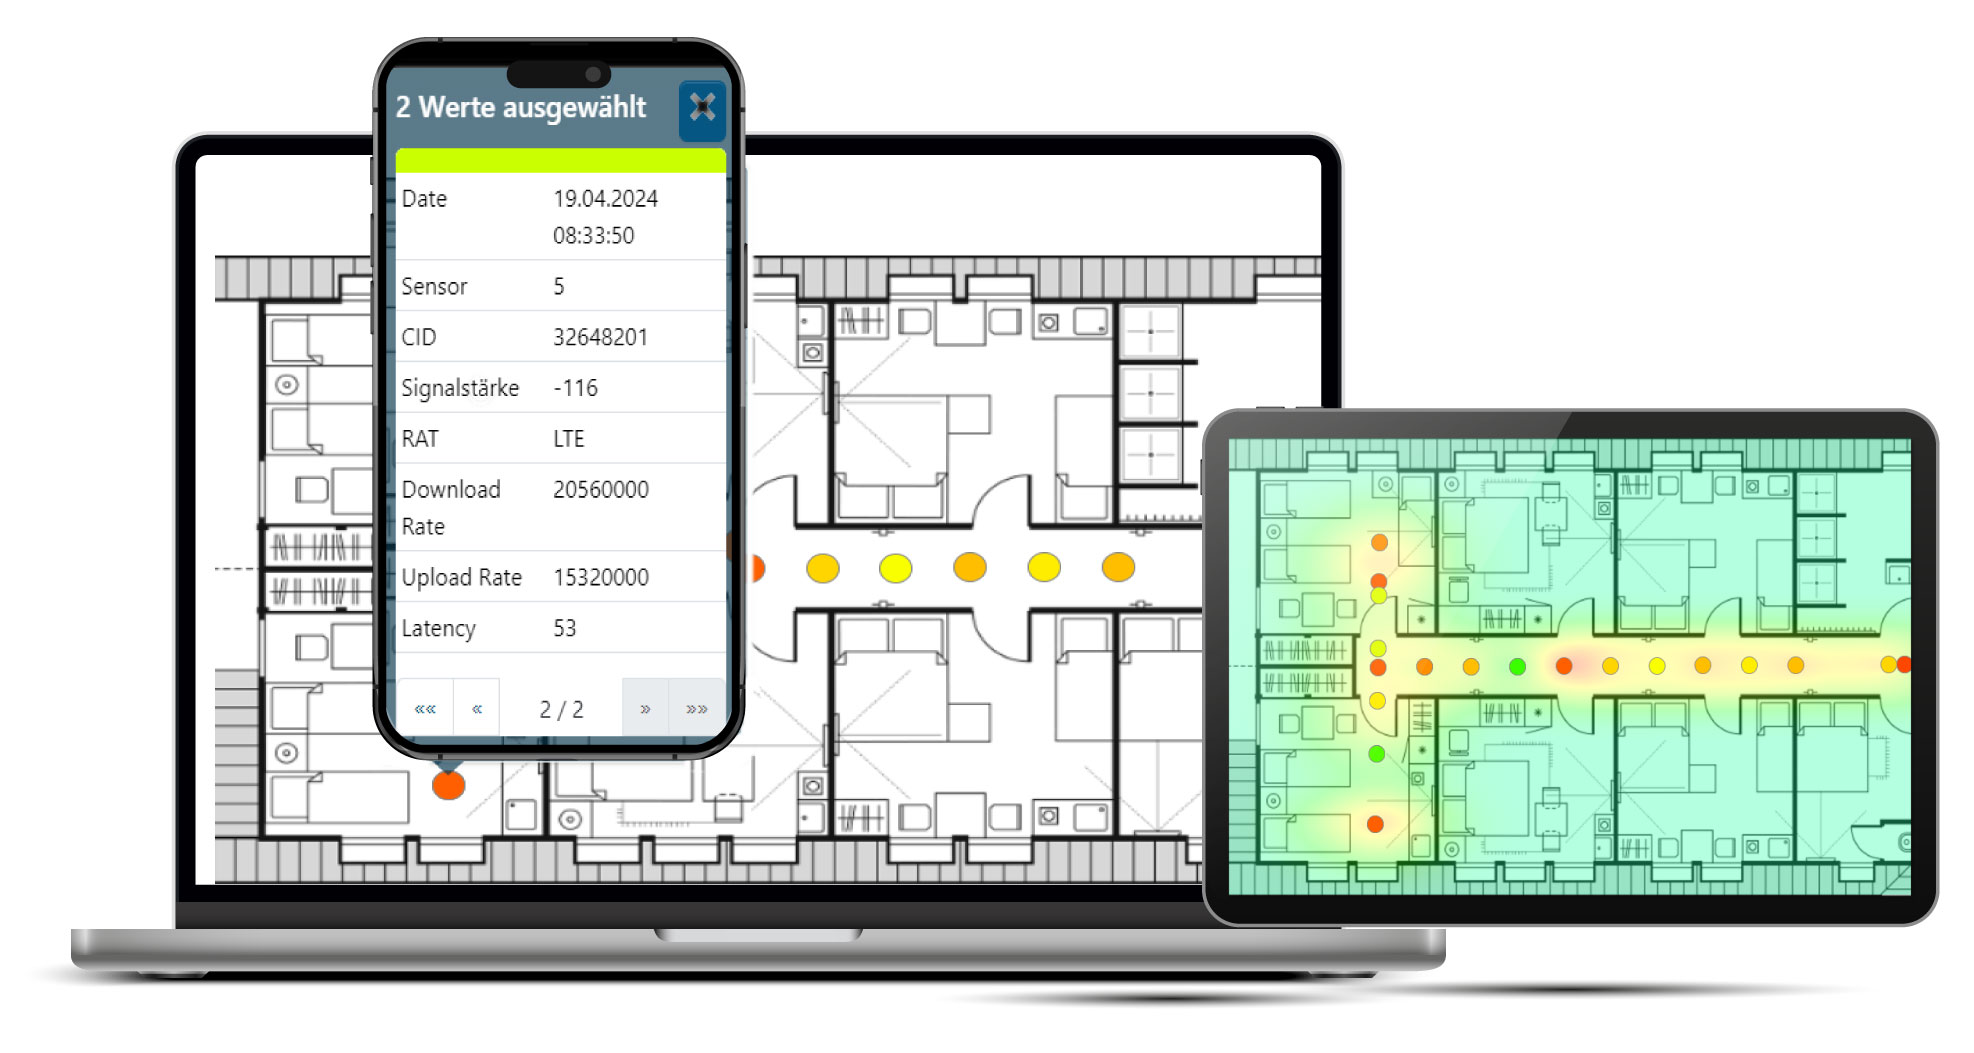
Complex measurements with many sensors or measuring points can lead to overlaps in the display. To maintain an overview, the system offers a detail view with which all recorded values can be displayed individually – including signal strength, cell ID (CID) and more.

Surface visualization of signal strength within a building layout – heatmap representation of network coverage with customizable layers for detailed analysis.

For a clear visualization of continuous values such as the received signal strength, a Surface View is available. This interpolates the measurement data into a continuous display, e.g. as a heat map.

In addition, layers can be shown and hidden – depending on whether, for example, individual technologies, frequency ranges or network operators are to be viewed separately.

👉 Benefits for the user:

  • Clear evaluation even with many superimposed measuring points
  • Flexible switching between raw data and area visualization
  • Focus on relevant network aspects through targeted layer control
Software interface with additional wireless measurement analysis tools – including automatic map tracking, grayscale mode, anchor point deletion, and snapshot creation for efficient data evaluation and documentation.

Additional analysis functions – targeted evaluation made easy

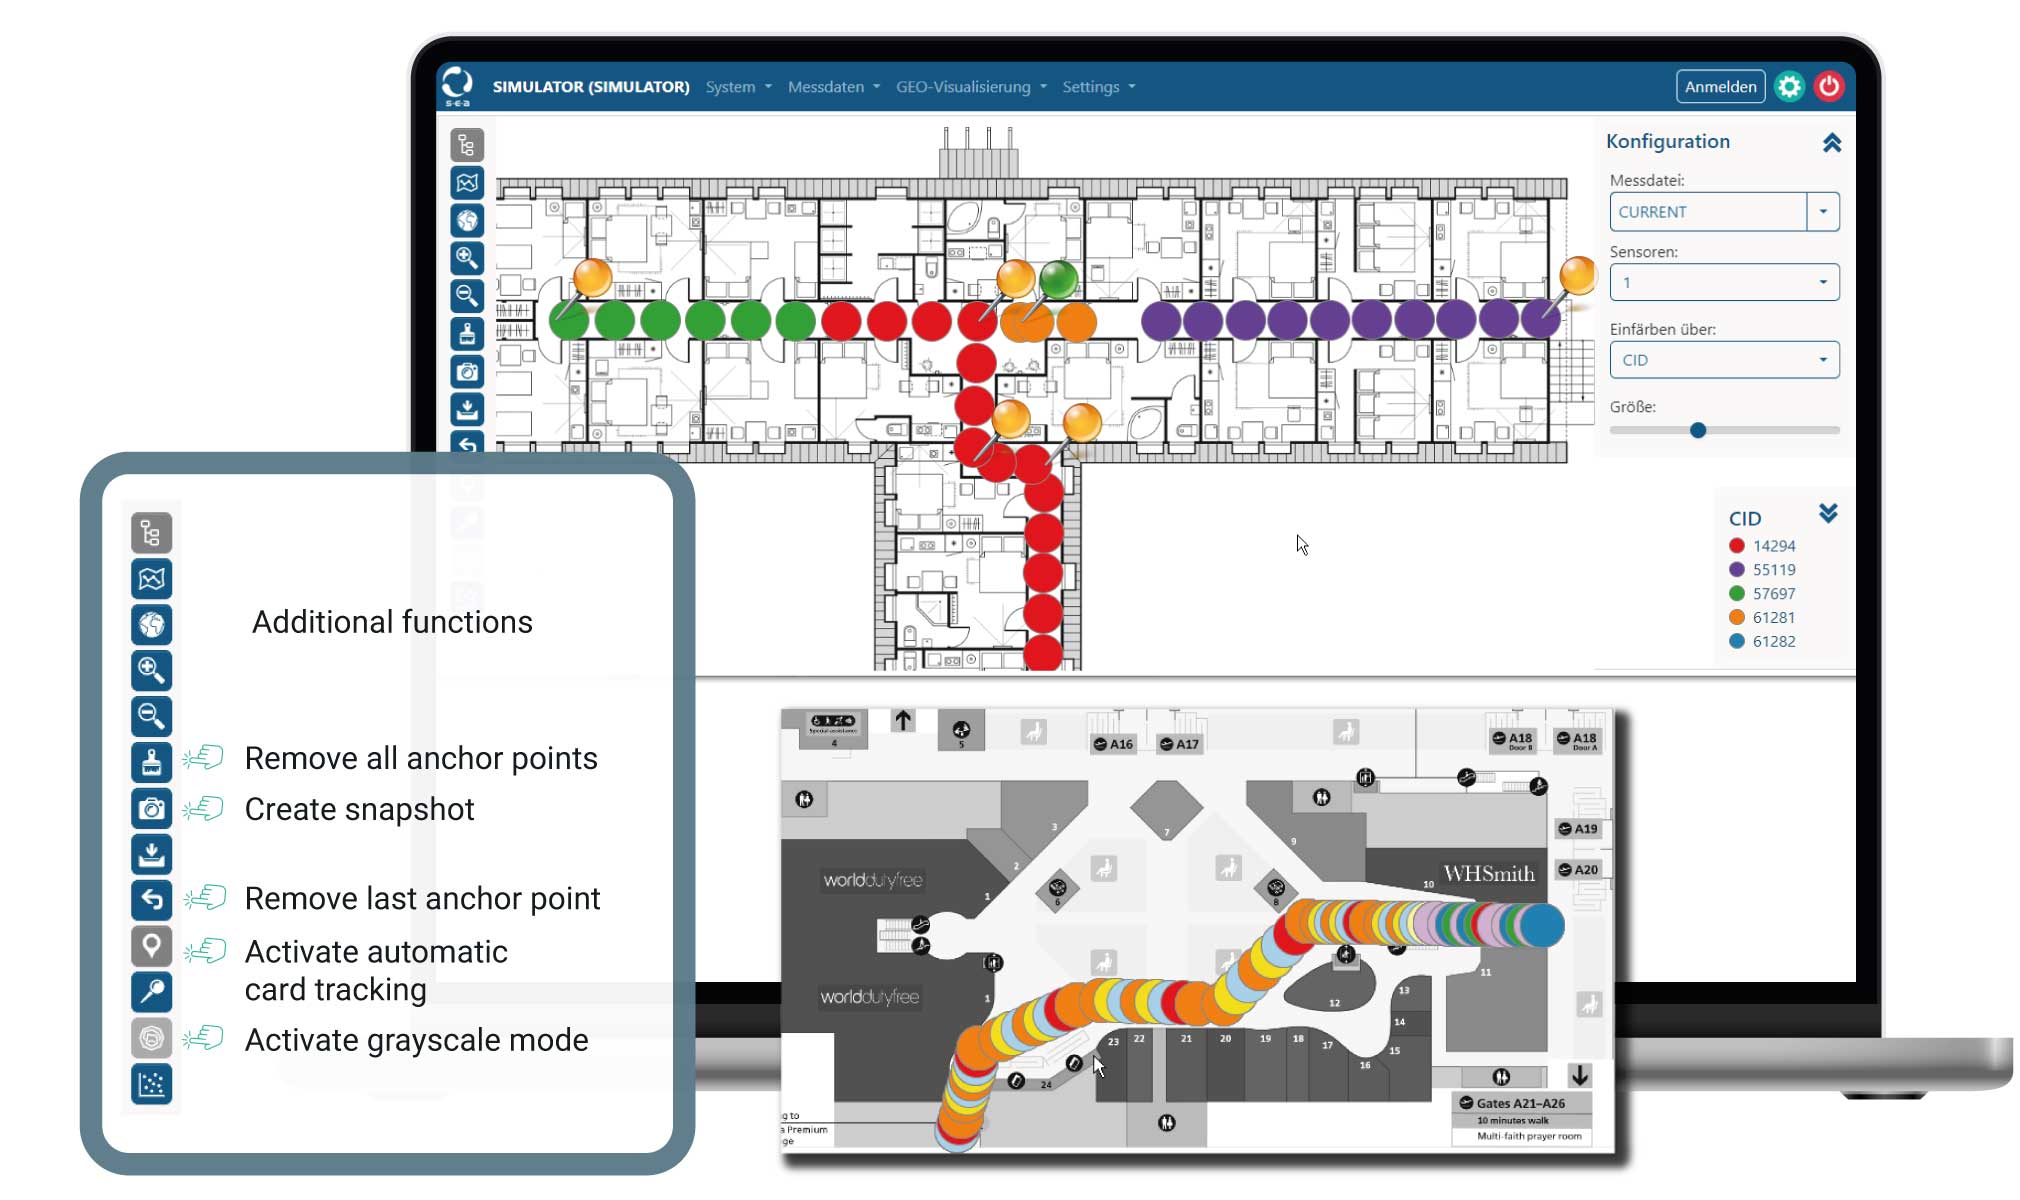
For even more efficient evaluation of the measurement data, the system offers practical additional functions:

  • Automatic map tracking
    The map automatically follows the course of the measurement – ideal for long routes or live analyses.
  • Delete anchor points
    Remove the last anchor point set or all anchor points to make corrections quickly.
  • Save snapshots
    Save important analysis views as an image – for documentation or team communication.
  • Enable grayscale mode
    Shift the building plan to grayscale so that measurement data such as signal strength heatmaps are more clearly visible.

These functions help you to precisely evaluate and clearly display even extensive measurements.

Nahaufnahme eines Fingers, der auf ein digitales Ordnersymbol mit dem Wort „Export“ tippt – daneben Beispiele von exportierten Funkmessberichten mit farblicher Signalstärkenvisualisierung auf Gebäudegrundrissen

5. report generation

Transparency and documentation for decisions based on data

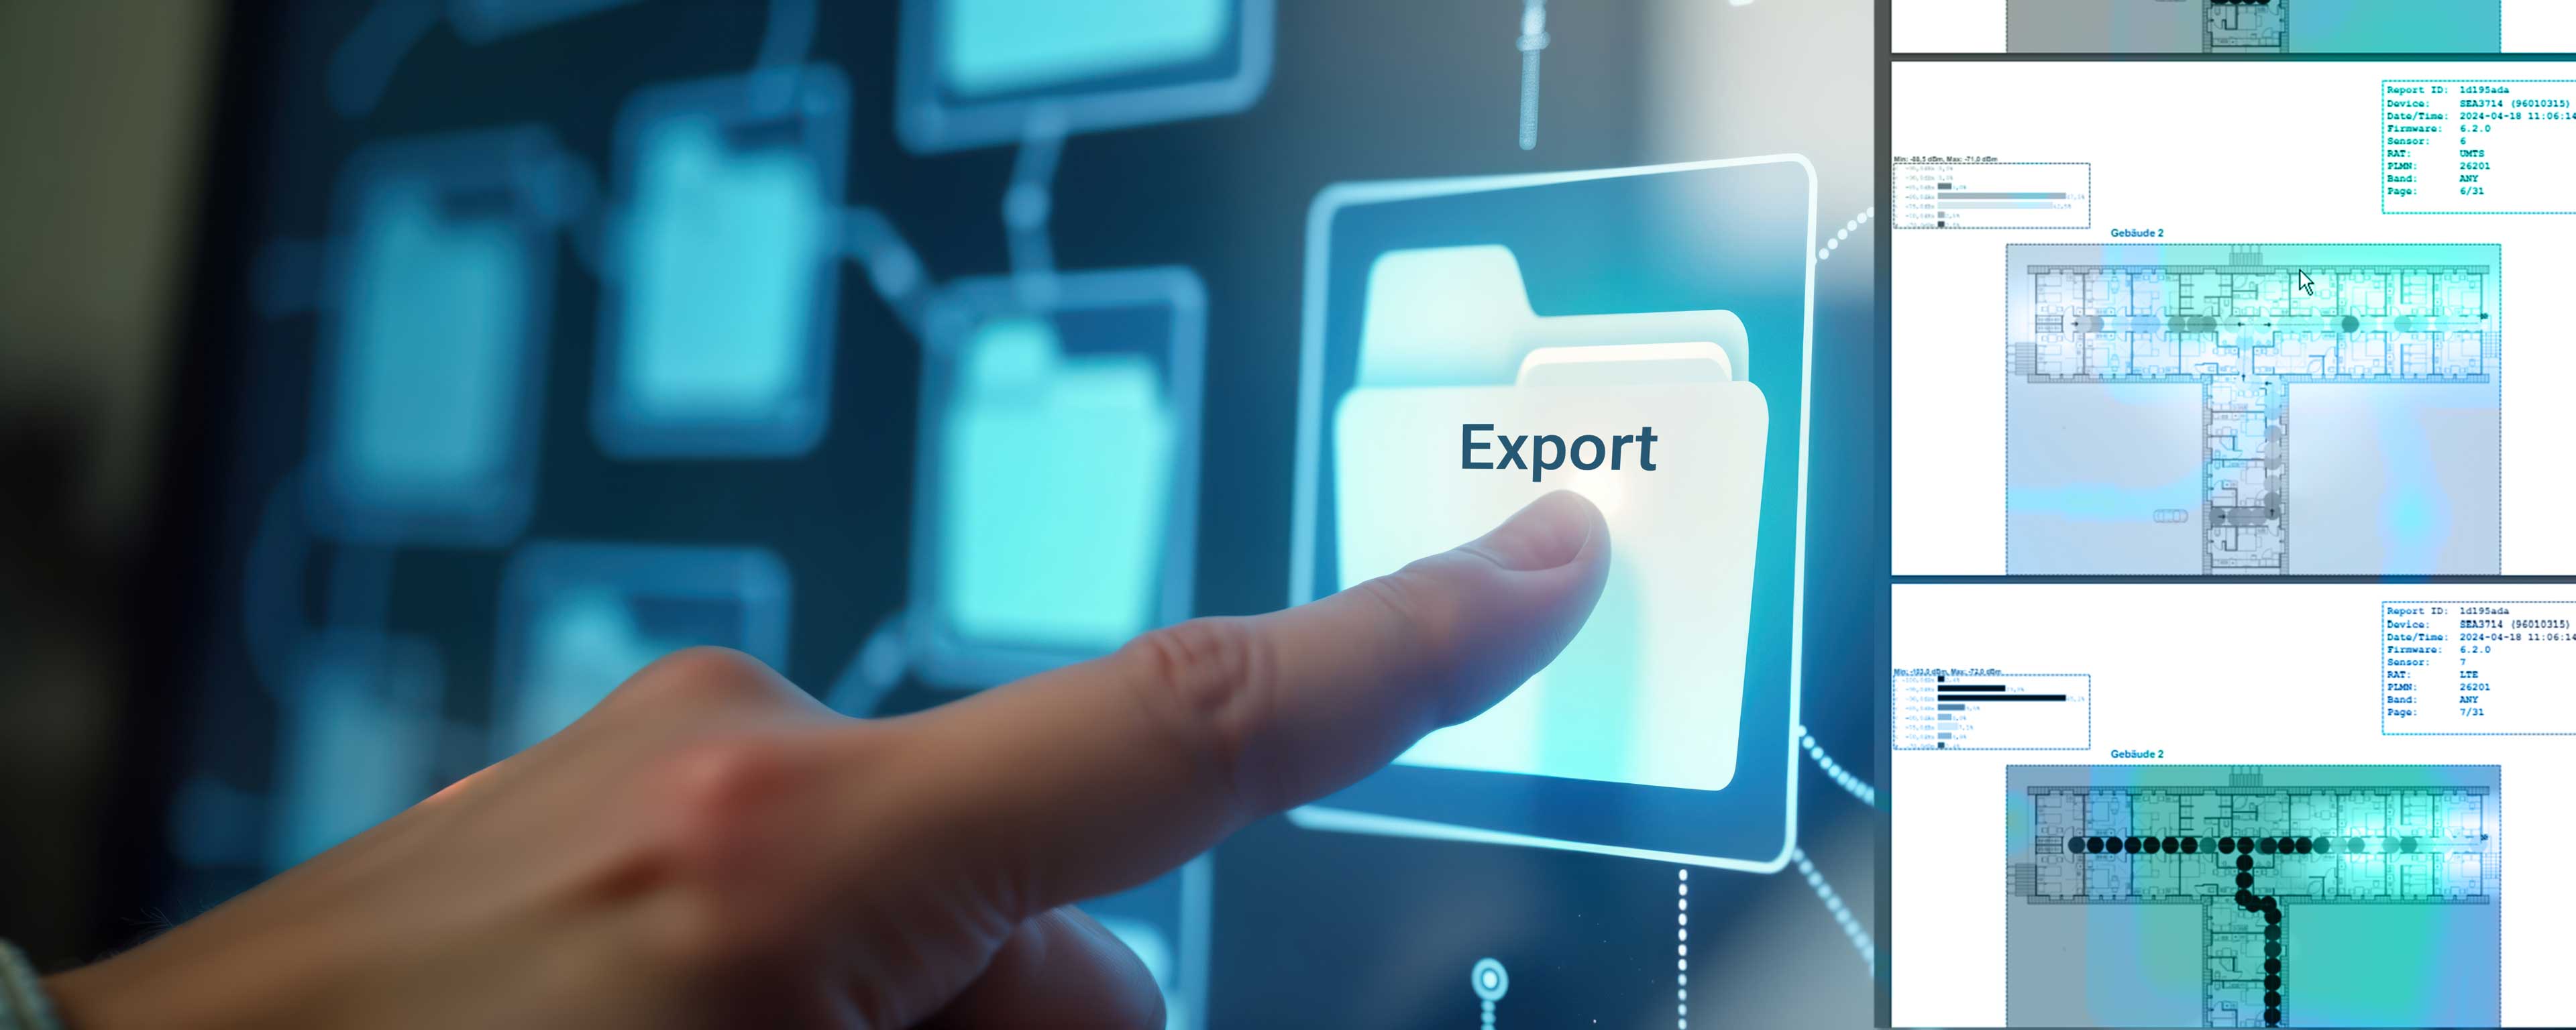
At the end, you receive structured evaluations and reports:

  • output as PDF, CSV or interactive web reports
  • Georeferencing for GIS connection (e.g., SpaceMaster GEO)
  • Optional: recommendations for optimization, planning, or network structure
Software interface for wireless measurement data history – file selection of previous measurement sessions for review and visualization on floor plans and street maps.

Reuse completed measurements

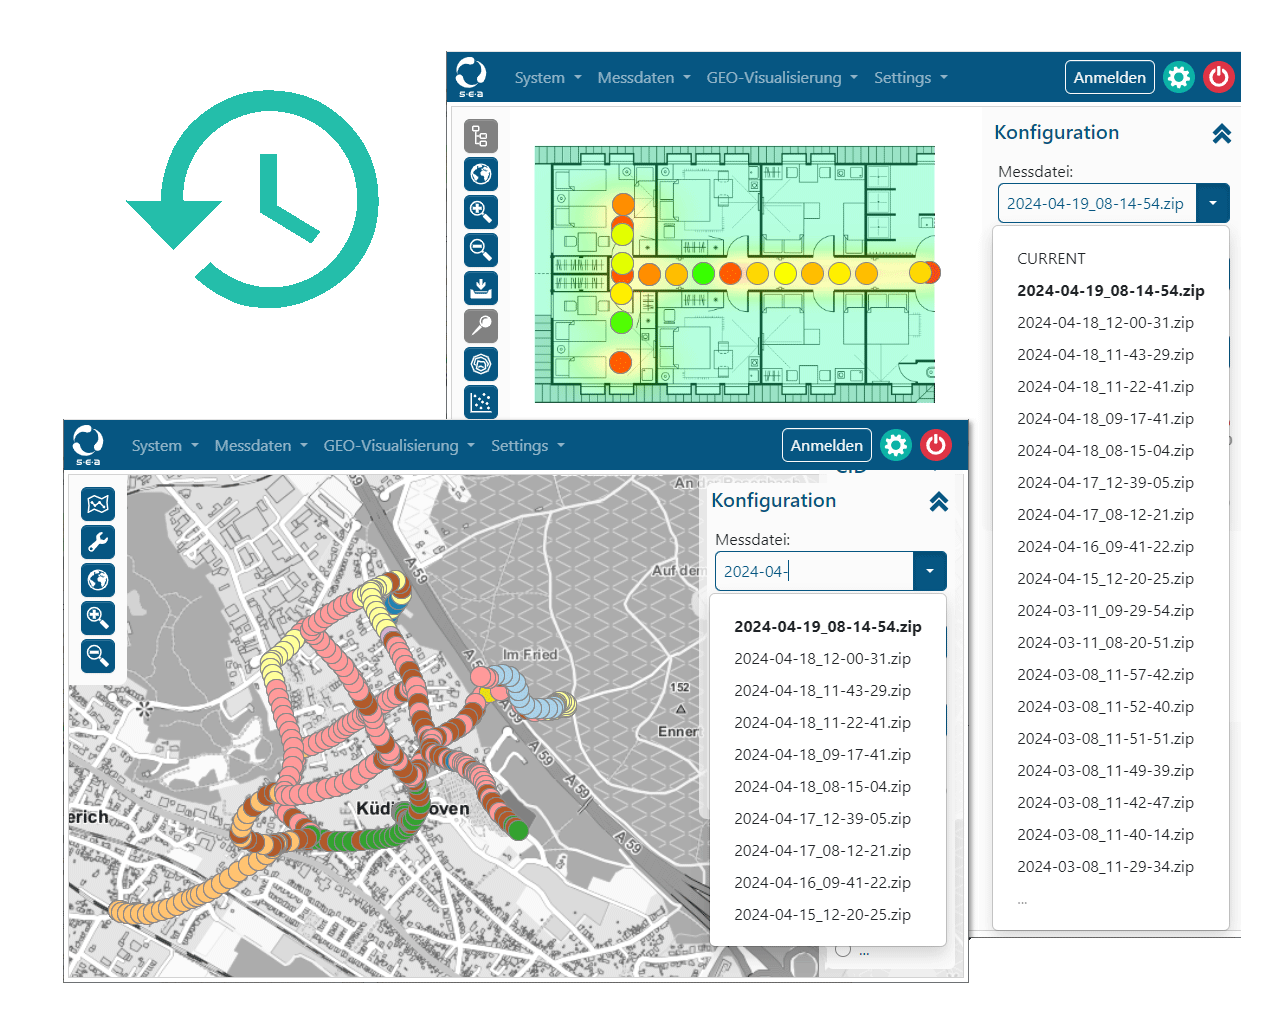
Measurements that have already been carried out remain fully traceable and can be reopened at any time if required:

  • measurement files are saved locally and are reusable
  • Filter functions make file selection easier
  • The recorded measurement points remain unchanged so that no subsequent editing is possible – maximum data integrity
  • Visualizations can be adjusted, reports regenerated and downloaded (e.g. for new questions or for later analyses)
Illustration zur Datensammlung bei der Funkvermessung – strukturierte Zusammenführung von JSON-, Log-, Bild- und Grundrissdateien in einer zentralen Projektmappe.

Clearly structured file formats for your documentation

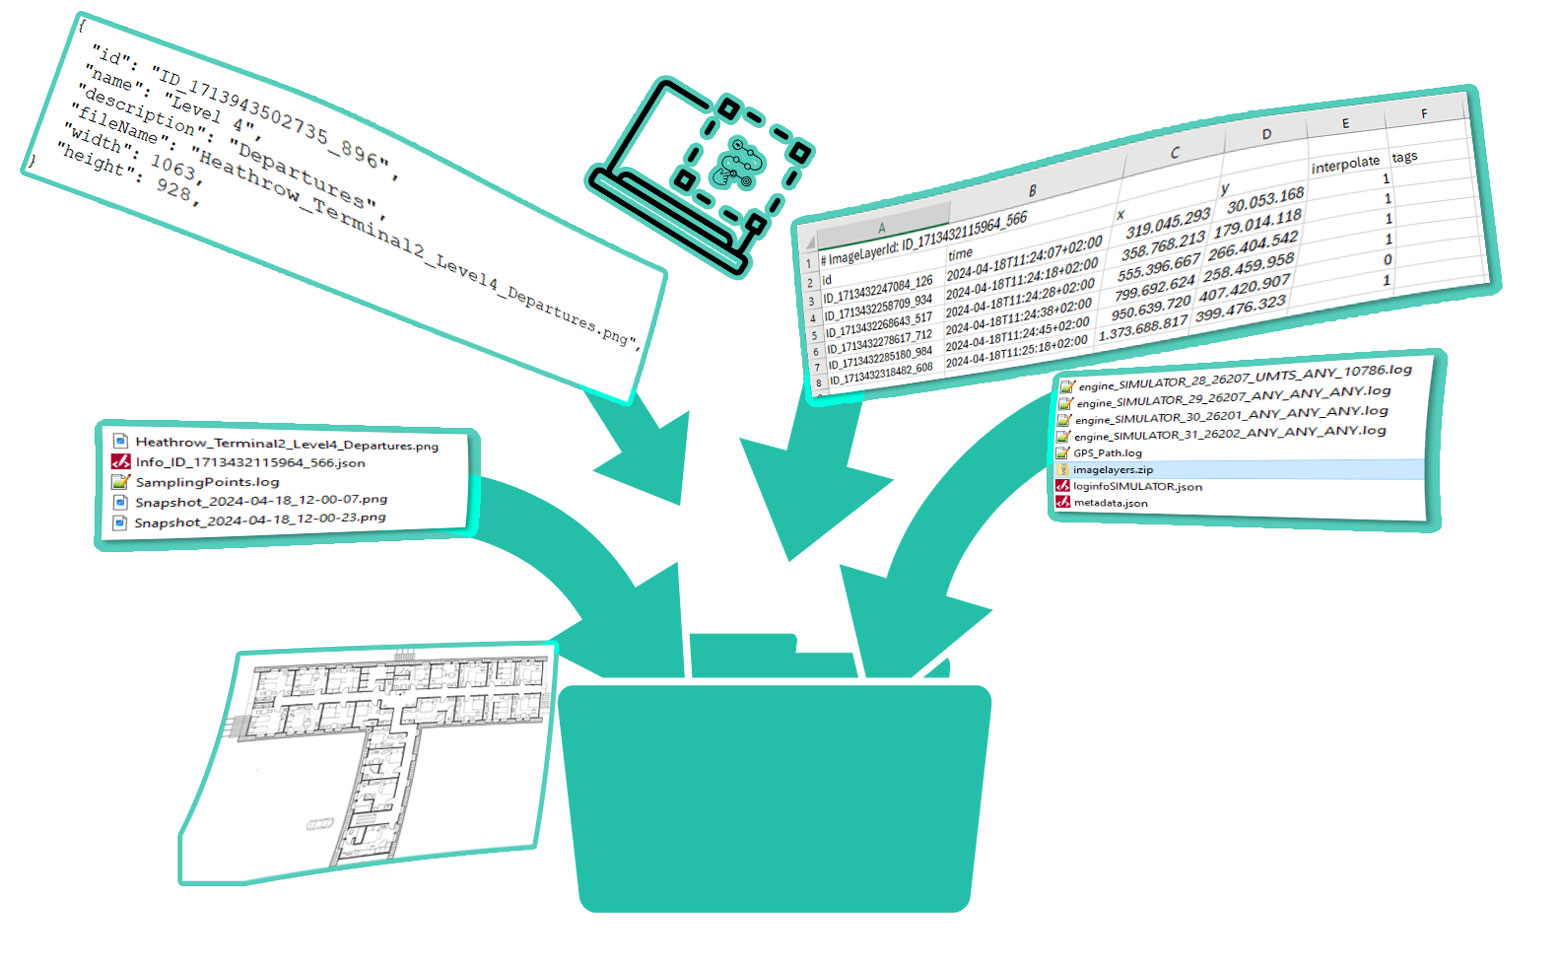
Each measurement file contains a complete object tree including all recorded planes and surfaces. Each object level (“node”) contains:

  • 🏢 Ground plan as an image file (e.g. PNG)
  • 📄 Metadata for the measurement
  • 📍 Anchor points as a text file incl. timestamp & coordinates
  • 📸 Snapshots for visualization purposes

Flexible use – how you can benefit from our solution

Whether you need a one-off radio measurement or want to implement your own long-term measurement projects – we offer you exactly the scope you need:

✅Our range of services at a glance:

You decide whether we take care of everything for you or you build up your own expertise – either way, we support you with experience and technology.

Complete package
Everything from a single source: Consulting, professional measurement implementation with state-of-the-art hardware and structured results reports for your planning.

Consulting & Analysis
Would you like to measure or analyze yourself? We support you with the measurement configuration, data acquisition and interpretation of the results.

Measuring devices for rent or purchase
Our precise radio measuring systems are also available for use by your own personnel – including instruction and support.

Software solutions for any scale
Analysis and evaluation systems as local installation or hosted service – scalable from individual buildings to cities and countries.

Make optimum use of your infrastructure – with precisely planned radio coverage

.

We analyze your requirements and develop the right solution.

Frequently asked questions about indoor radio measurement

Think bigger? – We also survey entire cities, sites & outdoor areas

Do you have an extensive site, a campus or would you like to check the mobile coverage around your buildings to optimize your network planning?
Then it’s worth taking a look at our drive test survey for entire cities, municipalities or industrial sites.
Indoor and outdoor often go hand in hand – we offer both.
Learn more about outdoor mobile network surveying
Mobile network survey

We are on site

Will we see you at one of these exhibitions and events?

S.E.A. exhibition dates